Written reports provide detailed, structured documentation ideal for complex data analysis and formal record-keeping in communication pet projects. Data storytelling transforms raw data into engaging narratives that enhance understanding and emotional connection, making information more accessible for diverse audiences. Combining both approaches ensures comprehensive information sharing, balancing factual accuracy with compelling presentation.
Table of Comparison
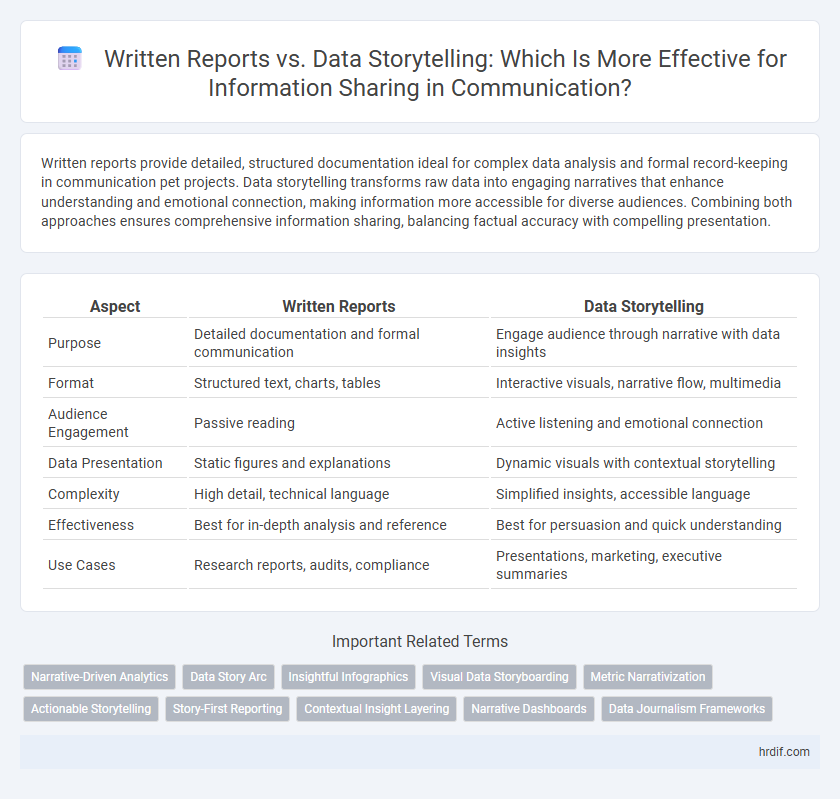
| Aspect | Written Reports | Data Storytelling |
|---|---|---|
| Purpose | Detailed documentation and formal communication | Engage audience through narrative with data insights |
| Format | Structured text, charts, tables | Interactive visuals, narrative flow, multimedia |
| Audience Engagement | Passive reading | Active listening and emotional connection |
| Data Presentation | Static figures and explanations | Dynamic visuals with contextual storytelling |
| Complexity | High detail, technical language | Simplified insights, accessible language |
| Effectiveness | Best for in-depth analysis and reference | Best for persuasion and quick understanding |
| Use Cases | Research reports, audits, compliance | Presentations, marketing, executive summaries |
Understanding Written Reports in the Workplace
Written reports in the workplace are structured documents that present facts, analysis, and recommendations systematically, ensuring clarity and accountability. They often include detailed data, charts, and formal language to support decision-making processes within organizations. Understanding the format and purpose of written reports enhances effective communication by providing a reliable reference for stakeholders.
The Rise of Data Storytelling in Professional Communication
Data storytelling is revolutionizing professional communication by transforming complex data into engaging narratives that enhance comprehension and retention. Unlike traditional written reports, which often present information in dense, technical formats, data storytelling leverages visualizations and contextual insights to drive decision-making and stakeholder engagement. This emerging trend underscores the increasing value of integrating analytical data with compelling storytelling techniques to facilitate clearer, more impactful information sharing.
Key Differences Between Written Reports and Data Storytelling
Written reports present data systematically with detailed analysis and structured sections, prioritizing comprehensive documentation and formal tone. Data storytelling combines data visualization with narrative techniques to engage audiences emotionally, simplifying complex information for easier understanding and decision-making. Written reports suit technical accuracy, while data storytelling enhances retention and persuasive communication by contextualizing data within relatable stories.
The Role of Clarity and Engagement in Information Sharing
Written reports provide detailed, structured information with a formal tone that enhances clarity through organized data presentation and clear headings. Data storytelling leverages narratives and visual elements to increase engagement, making complex information more relatable and easier to understand. Balancing clarity with engagement ensures that the audience not only receives accurate data but also remains motivated to absorb and apply the information effectively.
When to Use Traditional Written Reports
Traditional written reports are ideal for detailed documentation requiring formal structure, comprehensive data analysis, and official record-keeping. They suit scenarios demanding precise references, complex data presentation, and regulatory compliance, such as financial audits or technical evaluations. Organizations rely on written reports to ensure clarity, accountability, and consistency in communication across teams and stakeholders.
Advantages of Data Storytelling for Career Communication
Data storytelling transforms complex data into compelling narratives, enhancing clarity and engagement in career communication. By integrating visual elements and contextual insights, it aids professionals in conveying key messages effectively, fostering decision-making and collaboration. This approach boosts influence and credibility, enabling clearer, memorable presentations that drive career advancement.
Common Pitfalls of Written Reports vs. Data Storytelling
Written reports often suffer from dense, technical language and lack of engagement, causing difficulty in information retention and stakeholder buy-in. Data storytelling leverages visualizations and narrative techniques to simplify complex data, but risks oversimplification or bias if not grounded in accurate analysis. Both methods require careful attention to clarity, relevance, and audience understanding to effectively convey key insights.
Enhancing Decision-Making with Effective Data Presentation
Written reports provide detailed, structured information with comprehensive data analysis, supporting thorough understanding and reference. Data storytelling leverages visualizations and narrative techniques to highlight key insights, making complex data more accessible and memorable. Combining both approaches enhances decision-making by ensuring clarity, engagement, and actionable interpretation of critical information.
Choosing the Right Communication Method for Your Job
Written reports provide detailed, structured information ideal for formal analysis and comprehensive documentation, ensuring accuracy and completeness in professional settings. Data storytelling combines visuals and narrative techniques to engage audiences, making complex data more accessible and memorable for decision-making processes. Selecting the right communication method depends on the audience's needs, the message complexity, and the desired impact to maximize clarity and effectiveness in information sharing.
Future Trends: Evolving from Reports to Narrative-Driven Insights
Written reports remain foundational for structured information sharing, but data storytelling is rapidly gaining prominence by transforming raw data into engaging narratives that enhance comprehension and decision-making. Future trends indicate a shift toward integrating interactive visuals and AI-driven analytics within narratives, enabling personalized, real-time insights that cater to diverse audience needs. Organizations embracing narrative-driven insights are positioned to improve stakeholder engagement, accelerate strategic actions, and foster a data-informed culture.
Related Important Terms
Narrative-Driven Analytics
Written reports provide structured, detailed documentation suited for comprehensive analysis, while data storytelling leverages narrative-driven analytics to engage audiences, making complex data accessible and memorable. Narrative-driven analytics integrates data visualization and contextual storytelling, enhancing decision-making by highlighting key insights and trends in a compelling, human-centered format.
Data Story Arc
Written reports often overwhelm readers with dense data, while data storytelling leverages the Data Story Arc to present information through a clear structure of setup, conflict, and resolution, enhancing engagement and comprehension. This narrative framework transforms raw data into meaningful insights, making complex information accessible and memorable for diverse audiences.
Insightful Infographics
Insightful infographics enhance written reports by transforming complex data into visually engaging, easily interpretable stories that improve information retention and audience engagement. Data storytelling leverages these visual tools to highlight key insights and trends, making communication more impactful than traditional text-heavy reports.
Visual Data Storyboarding
Visual data storyboarding enhances written reports by transforming complex data into compelling narratives with clear, engaging visuals that improve information retention and decision-making. This approach leverages sequential graphics and annotated charts to guide audiences through insights, making data more accessible and actionable compared to traditional text-heavy reports.
Metric Narrativization
Written reports present data through structured text and tables, prioritizing comprehensive metric documentation and formal analysis. Data storytelling enhances metric narrativization by transforming complex data into engaging narratives that highlight key trends and insights, improving information retention and decision-making.
Actionable Storytelling
Written reports often present raw data and detailed analysis but can lack engagement and clarity for decision-making, limiting immediate action. Data storytelling transforms complex information into compelling narratives with visualizations that highlight insights, making it easier for stakeholders to understand key messages and take prompt, informed actions.
Story-First Reporting
Story-first reporting enhances written reports by structuring data around a clear narrative that engages readers and clarifies key insights, improving information retention and decision-making. This approach leverages data storytelling techniques such as context, visualization, and emotional appeal to transform raw data into compelling, actionable messages.
Contextual Insight Layering
Written reports provide structured data presentation but often lack the dynamic contextual insight layering that data storytelling offers, which integrates narrative elements to highlight key trends and implications. Data storytelling enhances information sharing by embedding context directly into visualized data, enabling deeper understanding and more actionable insights.
Narrative Dashboards
Narrative dashboards combine dynamic data visualization with storytelling elements, enhancing comprehension and engagement compared to traditional written reports. These interactive tools enable stakeholders to grasp insights quickly by contextualizing metrics within a coherent narrative, improving decision-making efficiency.
Data Journalism Frameworks
Written reports often present raw data and detailed analysis using structured formats, while data storytelling in communication leverages visualization frameworks like narrative arcs and interactive dashboards to enhance comprehension and engagement. Data journalism frameworks emphasize the integration of contextual insights, real-time data, and multimedia elements to transform complex datasets into compelling stories that drive informed decision-making.
Written Reports vs Data Storytelling for information sharing Infographic