Written reports provide detailed, structured information ideal for thorough analysis and record-keeping, while interactive dashboards offer real-time data visualization that enhances engagement and quick decision-making. Interactive dashboards enable users to explore data dynamically, uncover trends, and customize views, which is less feasible with static written reports. Combining both methods optimizes communication by delivering comprehensive insights alongside accessible, actionable data.
Table of Comparison
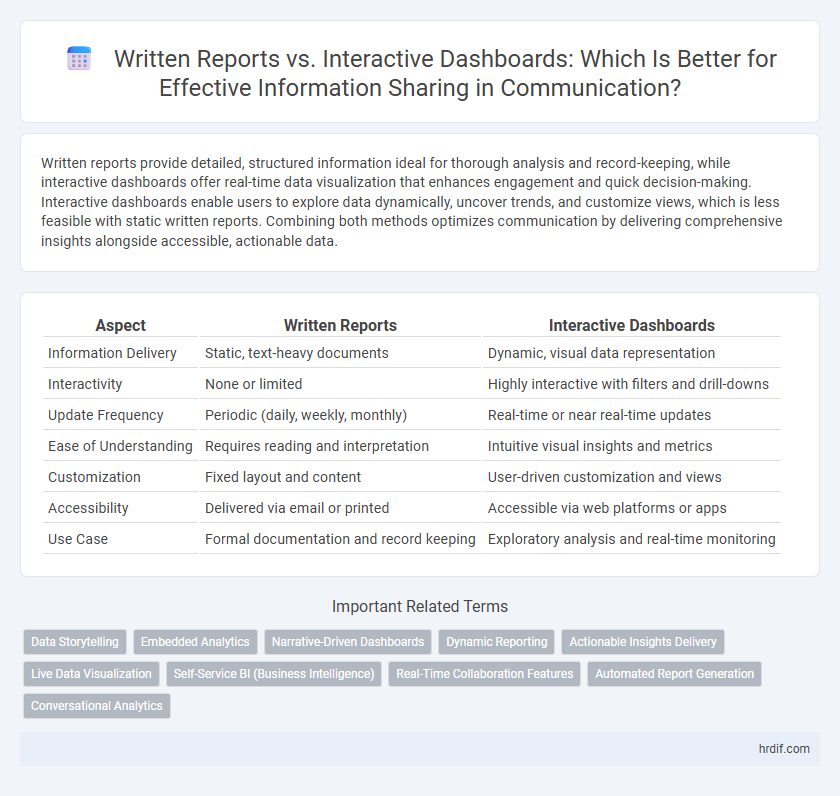
| Aspect | Written Reports | Interactive Dashboards |
|---|---|---|
| Information Delivery | Static, text-heavy documents | Dynamic, visual data representation |
| Interactivity | None or limited | Highly interactive with filters and drill-downs |
| Update Frequency | Periodic (daily, weekly, monthly) | Real-time or near real-time updates |
| Ease of Understanding | Requires reading and interpretation | Intuitive visual insights and metrics |
| Customization | Fixed layout and content | User-driven customization and views |
| Accessibility | Delivered via email or printed | Accessible via web platforms or apps |
| Use Case | Formal documentation and record keeping | Exploratory analysis and real-time monitoring |
Introduction: Evolving Information Sharing in the Workplace
Written reports offer structured, detailed documentation ideal for thorough analysis and record-keeping, while interactive dashboards enable real-time data visualization and dynamic user engagement. Organizations increasingly adopt dashboards to enhance decision-making speed and collaboration through intuitive interfaces displaying key performance indicators (KPIs). Balancing comprehensive insights from written reports with the immediacy and interactivity of dashboards fosters more effective information sharing in modern workplaces.
Key Differences: Written Reports vs Interactive Dashboards
Written reports provide detailed, static documentation ideal for comprehensive analysis and formal record-keeping, while interactive dashboards offer real-time data visualization and dynamic user engagement that supports quick decision-making. Written reports emphasize in-depth narrative explanations and context, whereas dashboards prioritize visual cues like charts and graphs to highlight trends and performance metrics instantly. The choice between the two depends on the communication goals, with written reports suited for thorough analysis and interactive dashboards designed for immediate insights and monitoring.
Advantages of Written Reports in Professional Communication
Written reports provide comprehensive and detailed documentation that ensures accuracy and consistency in professional communication. They allow for thorough analysis and structured presentation of complex data, facilitating in-depth understanding and reference over time. Written reports also serve as formal records that support compliance, accountability, and audit processes within organizations.
Benefits of Interactive Dashboards for Real-Time Insights
Interactive dashboards provide real-time data visualization, enabling users to monitor key performance indicators instantly and make data-driven decisions efficiently. Unlike static written reports, dashboards allow dynamic filtering and customization, enhancing user engagement and facilitating faster identification of trends and anomalies. This immediacy and interactivity improve collaboration and responsiveness across teams, leading to more proactive and informed communication.
Use Cases: When to Choose Written Reports
Written reports excel in contexts requiring detailed documentation, regulatory compliance, or formal record-keeping, providing comprehensive narratives with supporting data. They are ideal for conveying complex analyses, historical data trends, or strategic plans that stakeholders need to review thoroughly. Organizations should choose written reports when accuracy, context, and a permanent archive of information are paramount.
Use Cases: When to Opt for Interactive Dashboards
Interactive dashboards are ideal for real-time data monitoring, enabling stakeholders to explore trends through customizable visualizations and drill-down features. They excel in dynamic environments such as sales performance tracking, project management, and operational analytics where instant insights drive decision-making. Unlike static written reports, dashboards facilitate continuous engagement and quicker adaptation to changing data.
Collaboration and Engagement: Enhancing Team Communication
Interactive dashboards foster real-time collaboration by allowing team members to manipulate data and share insights instantly, enhancing engagement compared to static written reports. Written reports, while detailed and comprehensive, often limit dynamic interaction and delay feedback, reducing opportunities for collaborative problem-solving. Utilizing interactive dashboards in team communication elevates engagement and accelerates decision-making by providing a shared, visually rich platform for exploring data collectively.
Accessibility and User Experience Considerations
Written reports offer detailed, structured documentation ideal for formal review but may pose challenges in quick data retrieval and adaptability across devices. Interactive dashboards enhance accessibility by providing real-time data visualization, user-friendly interfaces, and customization options that improve engagement and decision-making. Prioritizing responsive design and intuitive navigation ensures both tools meet diverse user needs and optimize information sharing efficiency.
Data Accuracy, Security, and Compliance Implications
Written reports provide a static snapshot of data that allows for thorough review and audit trails, enhancing data accuracy and compliance with regulatory standards. Interactive dashboards enable real-time data updates and user-driven exploration but require robust security measures to prevent unauthorized access and ensure data integrity. Both formats must align with organizational compliance frameworks, balancing transparency and data protection to mitigate risks.
Conclusion: Choosing the Right Tool for Effective Information Sharing
Written reports offer detailed, structured narratives ideal for comprehensive analysis and archival purposes, while interactive dashboards excel in real-time data visualization and dynamic user engagement. Selecting the right tool depends on the audience's needs, the complexity of information, and the desired level of interaction. Integrating both can enhance communication strategies by providing depth through reports and clarity through dashboards.
Related Important Terms
Data Storytelling
Written reports provide detailed narratives that guide readers through complex data sets, enabling deep understanding and comprehensive analysis. Interactive dashboards enhance data storytelling by allowing users to explore real-time metrics and customize views, fostering dynamic engagement and immediate insights.
Embedded Analytics
Embedded analytics transforms written reports into dynamic, interactive dashboards that enable real-time data exploration and faster decision-making. This integration facilitates seamless information sharing by embedding analytical insights directly within business applications, enhancing user engagement and comprehension.
Narrative-Driven Dashboards
Narrative-driven dashboards enhance information sharing by combining data visualization with contextual storytelling, enabling users to grasp insights quickly and make informed decisions. Unlike traditional written reports, these dashboards offer dynamic, real-time updates and interactive elements that improve engagement and comprehension.
Dynamic Reporting
Interactive dashboards provide dynamic reporting by enabling real-time data visualization and immediate updates, enhancing decision-making efficiency compared to static written reports. Their ability to drill down into metrics and customize views allows stakeholders to explore insights interactively, fostering more responsive and data-driven communication.
Actionable Insights Delivery
Written reports provide detailed narratives and static data visualizations that support comprehensive analysis but may delay decision-making due to infrequent updates. Interactive dashboards deliver real-time data and dynamic visualizations enabling immediate identification of trends and actionable insights for faster, data-driven decisions.
Live Data Visualization
Interactive dashboards provide live data visualization, enabling real-time insights and dynamic updates that enhance decision-making efficiency compared to static written reports. These dashboards allow users to drill down into data, filter metrics, and monitor key performance indicators instantly, improving responsiveness and collaboration.
Self-Service BI (Business Intelligence)
Written reports provide detailed, static data snapshots ideal for comprehensive analysis, while interactive dashboards enable real-time data exploration and customization, enhancing self-service BI capabilities by allowing users to dynamically filter and visualize metrics without IT intervention. Self-service BI leverages interactive dashboards to empower business users with immediate insights, boosting decision-making speed and flexibility compared to traditional static report formats.
Real-Time Collaboration Features
Interactive dashboards excel in real-time collaboration by allowing multiple users to simultaneously view, edit, and analyze data, enhancing decision-making speed and accuracy. Written reports lack these dynamic features, often resulting in delayed updates and limited opportunities for immediate feedback or collective input.
Automated Report Generation
Automated report generation streamlines written report creation by rapidly compiling and formatting data into structured documents, ensuring consistent and accurate information sharing. Interactive dashboards offer real-time data visualization but rely on user engagement for insights, whereas automated reports deliver scheduled, comprehensive summaries ideal for formal communication.
Conversational Analytics
Written reports provide detailed, static information that supports comprehensive review and record-keeping, while interactive dashboards enable real-time data exploration and dynamic insights through conversational analytics. Conversational analytics enhances user engagement by allowing natural language queries for instant answers, making interactive dashboards more effective for collaborative decision-making and adaptive communication.
Written Reports vs Interactive Dashboards for information sharing. Infographic