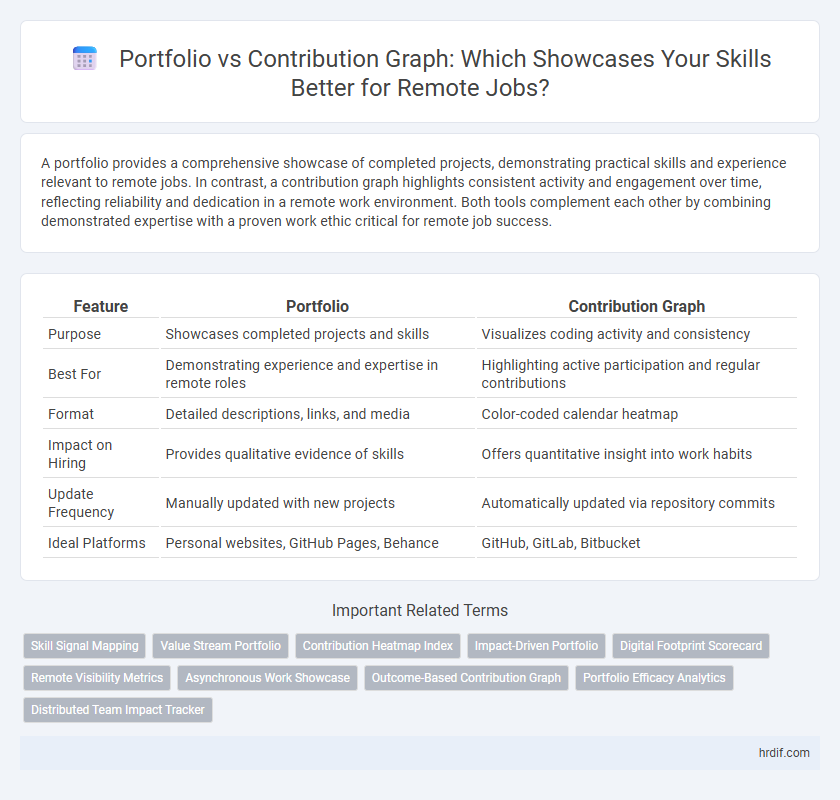
A portfolio provides a comprehensive showcase of completed projects, demonstrating practical skills and experience relevant to remote jobs. In contrast, a contribution graph highlights consistent activity and engagement over time, reflecting reliability and dedication in a remote work environment. Both tools complement each other by combining demonstrated expertise with a proven work ethic critical for remote job success.
Table of Comparison
| Feature | Portfolio | Contribution Graph |
|---|---|---|
| Purpose | Showcases completed projects and skills | Visualizes coding activity and consistency |
| Best For | Demonstrating experience and expertise in remote roles | Highlighting active participation and regular contributions |
| Format | Detailed descriptions, links, and media | Color-coded calendar heatmap |
| Impact on Hiring | Provides qualitative evidence of skills | Offers quantitative insight into work habits |
| Update Frequency | Manually updated with new projects | Automatically updated via repository commits |
| Ideal Platforms | Personal websites, GitHub Pages, Behance | GitHub, GitLab, Bitbucket |
Understanding Portfolios in the Remote Job Market
Portfolios showcase a candidate's skills, projects, and achievements through detailed evidence, making them essential for demonstrating real-world experience in remote job markets. Contribution graphs visualize activity and consistency on platforms like GitHub, reflecting ongoing engagement but lacking depth in project complexity. Employers prioritize portfolios over contribution graphs to assess competence, creativity, and problem-solving abilities critical for remote roles.
What is a Contribution Graph?
A contribution graph is a visual representation of an individual's activity and involvement in remote jobs over time, typically highlighting the frequency and consistency of their contributions to projects or repositories. This graph helps employers quickly assess a candidate's work patterns, commitment, and growth in a remote work setting. Unlike a portfolio that showcases completed projects, a contribution graph emphasizes ongoing engagement and regular input, providing insights into a remote worker's reliability and productivity.
Key Differences Between Portfolios and Contribution Graphs
Portfolios showcase comprehensive evidence of skills and completed projects, highlighting an individual's expertise and work quality, while contribution graphs visually track daily activity and consistency over time. Portfolios emphasize depth through detailed descriptions, outcomes, and diverse work samples, whereas contribution graphs prioritize frequency and regularity of contributions, often indicating commitment and engagement. In remote job contexts, portfolios provide evaluators with concrete proof of capability, while contribution graphs serve as supplementary evidence of ongoing involvement and professional habits.
Showcasing Skills: Portfolio vs. Contribution Graph
Portfolios provide a comprehensive showcase of skills through detailed project descriptions, code samples, and case studies that demonstrate problem-solving abilities and creativity in remote jobs. Contribution graphs highlight consistency and frequency of coding activity, signaling engagement and reliability to potential employers. Combining a portfolio with an active contribution graph creates a powerful synergy, enhancing a candidate's visibility and credibility in remote work environments.
Remote Employers’ Preferences: Which Matters More?
Remote employers prioritize portfolios over contribution graphs when evaluating candidates, as portfolios showcase tangible skills, completed projects, and real-world problem-solving abilities. Contribution graphs, while indicative of consistent activity, often lack context on the complexity or impact of the work performed. Hiring managers prefer portfolios that demonstrate practical experience and relevant expertise aligned with the job requirements.
Measuring Impact: Contribution Graph Insights
Contribution graphs visually represent daily activity and consistency, offering real-time data on work patterns and productivity for remote jobs. Unlike portfolios that showcase completed projects and skills, contribution graphs emphasize measurable impact through frequency and regularity of contributions. Employers use these insights to assess commitment, collaboration, and ongoing engagement beyond static project outcomes.
Visual Storytelling: Portfolio Advantages
A portfolio offers a dynamic visual storytelling platform that showcases a candidate's skills, experiences, and projects through rich multimedia elements such as images, videos, and detailed case studies. Unlike contribution graphs that primarily display coding activity over time, portfolios provide context and narrative, enabling remote job recruiters to grasp the depth and impact of one's work. This immersive presentation enhances personal branding and differentiates candidates in competitive remote job markets.
When to Use Each—Portfolio or Contribution Graph?
Portfolios showcase completed projects, skills, and achievements, making them ideal for demonstrating expertise during job applications or interviews for remote positions. Contribution graphs highlight consistent activity and engagement on platforms like GitHub, proving ongoing commitment and collaboration in coding environments. Use portfolios to present detailed work samples and contribution graphs to emphasize reliability and continuous involvement in open-source or collaborative remote work.
Building an Effective Portfolio for Remote Roles
Building an effective portfolio for remote roles highlights project diversity, clear documentation, and relevant skills showcasing adaptability to virtual collaboration tools like GitHub or GitLab. Contribution graphs visualize consistent work patterns and active engagement, reinforcing reliability and commitment essential for remote job success. Integrating portfolio projects with contribution data strengthens credibility and provides tangible evidence of ongoing professional development.
Future Trends: Evolving Proof of Work for Remote Jobs
Future trends in remote job validation emphasize dynamic portfolio platforms that integrate Contribution Graphs, enhancing real-time demonstration of skills and project impact. Evolving Proof of Work methods leverage blockchain and AI to authenticate contributions securely, enabling remote workers to showcase verifiable achievements and continuous growth. This shift promotes transparency and trust, transforming how employers assess candidate capabilities in decentralized work environments.
Related Important Terms
Skill Signal Mapping
A Portfolio showcases comprehensive project outcomes and practical experience, serving as a tangible Skill Signal that highlights specialized competencies and real-world application. In contrast, a Contribution Graph visualizes activity frequency on platforms like GitHub, offering a continuous Skill Signal that emphasizes consistency and engagement in remote job environments.
Value Stream Portfolio
Value Stream Portfolio provides a strategic overview of workstreams aligned with business objectives, enabling remote teams to prioritize initiatives based on value delivery rather than individual task contributions, which are typically visualized in Contribution Graphs. This approach enhances transparency and decision-making by linking remote job efforts directly to organizational outcomes, surpassing the limited scope of Contribution Graphs that focus solely on individual activity metrics.
Contribution Heatmap Index
The Contribution Heatmap Index visualizes activity patterns by tracking frequency and consistency of code commits, offering a real-time snapshot of developer engagement on remote job platforms. Portfolios highlight project outcomes and skills but lack the temporal interaction insights provided by the Contribution Heatmap Index, which better demonstrates ongoing commitment and productivity to potential employers.
Impact-Driven Portfolio
An impact-driven portfolio showcases measurable achievements and real-world results, highlighting skills and projects with tangible benefits that resonate with remote job recruiters. Unlike contribution graphs that primarily track activity frequency, an impact-driven portfolio emphasizes quality over quantity, demonstrating strategic problem-solving and value creation essential for remote roles.
Digital Footprint Scorecard
A Portfolio showcases comprehensive skills and project experience, serving as a detailed digital footprint that enhances a candidate's visibility and credibility to remote employers. Contribution Graphs track consistent activity and engagement in open-source or collaborative projects, directly impacting the Digital Footprint Scorecard by highlighting ongoing commitment and real-time contributions.
Remote Visibility Metrics
Portfolio showcases comprehensive project timelines and skill development, providing clear evidence of expertise in remote roles, while Contribution Graphs highlight consistent activity and collaboration frequency over time, serving as quantifiable remote visibility metrics valued by employers. Combining both tools enhances remote job candidates' profiles by demonstrating sustained productivity and skill mastery in distributed work environments.
Asynchronous Work Showcase
A portfolio provides a comprehensive and detailed representation of skills, projects, and achievements, making it ideal for showcasing expertise in remote asynchronous work environments. Contribution graphs highlight continuous activity and participation over time but lack the depth to fully demonstrate an individual's capabilities in completing complex, asynchronous tasks.
Outcome-Based Contribution Graph
Outcome-Based Contribution Graphs provide a dynamic visualization of measurable achievements and impact in remote jobs, highlighting specific project outcomes and productivity metrics rather than static work history. Unlike traditional portfolios, these graphs emphasize quantifiable results, offering employers clear insights into a candidate's effectiveness and value in remote work environments.
Portfolio Efficacy Analytics
Portfolio efficacy analytics measures the impact and quality of showcased projects, providing deeper insights into skills and achievements compared to contribution graphs that merely track activity frequency. An optimized portfolio demonstrates relevant expertise, project outcomes, and problem-solving abilities, making it a more reliable indicator for remote job recruiters assessing candidate suitability.
Distributed Team Impact Tracker
The Distributed Team Impact Tracker integrates portfolio visualization with contribution graphs to provide a comprehensive overview of individual and team progress in remote jobs. This tool highlights task completion, collaboration frequency, and impact metrics, enabling managers to assess distributed team performance more effectively.
Portfolio vs Contribution Graph for remote jobs. Infographic